Realtime analytics output
OpenSearch cluster Electricity Analytics
2025-10-31 Since the installation of the SigEnergy SigenStor battery system at Electricbrain HQ we more or less haven't used any electricity from the grid. This is reflected in the ToU graphs below. These graphs actually require a rework to use the numbers from the battery system and not the electricity meter. That really changes the whole point of this page - which was to minimize grid electricity usage. Electricbrain HQ is now effective off-grid. The original article follows.
Electricity Time of Use. This dashboard is composed of useage data aggregated over the last 30 days. It is updated daily.
More recently the data has been "rated" in an attempt to get a handle on power prices. What becomes clear from this process is that about 1/3 of the bill is just the connection fee (a poles & wires charge). The solar output now has more value as import replacement rather than grid feed in revenue.
On the whole the business case for solar in 2025 is touch and go with payback periods in the 5 years plus range. Add a battery and you're looking at 8 to 10 years plus. Here in Victoria grid scale solar and storage has had a profound effect. Clearly $5000 at grid scale goes many times further than tiny home scale installations where installers have to crawl on roofs, drill lots of holes, get electrical inspectors to look at a mere 10 panels, etc. etc. Gigantic solar farms get massive economies of scale.
With the changeover from gas hot water and gas climate control to their electric equivalents the economics are expected to change significantly however. In the near future there will be no gas meter at Electricbrain HQ which is expected have a profound effect on energy charges and payback periods (not to mention the climate).
The red line thresholds in the price graphs reflect the standing connection charges.
I'm regularly told by the electricity retailers that electricbrain is a very low user of power. Most housholds use three times the usage shown here. When the electric hot water and electric ducted climate replacement for gas are installed expect to see more normal consumption.
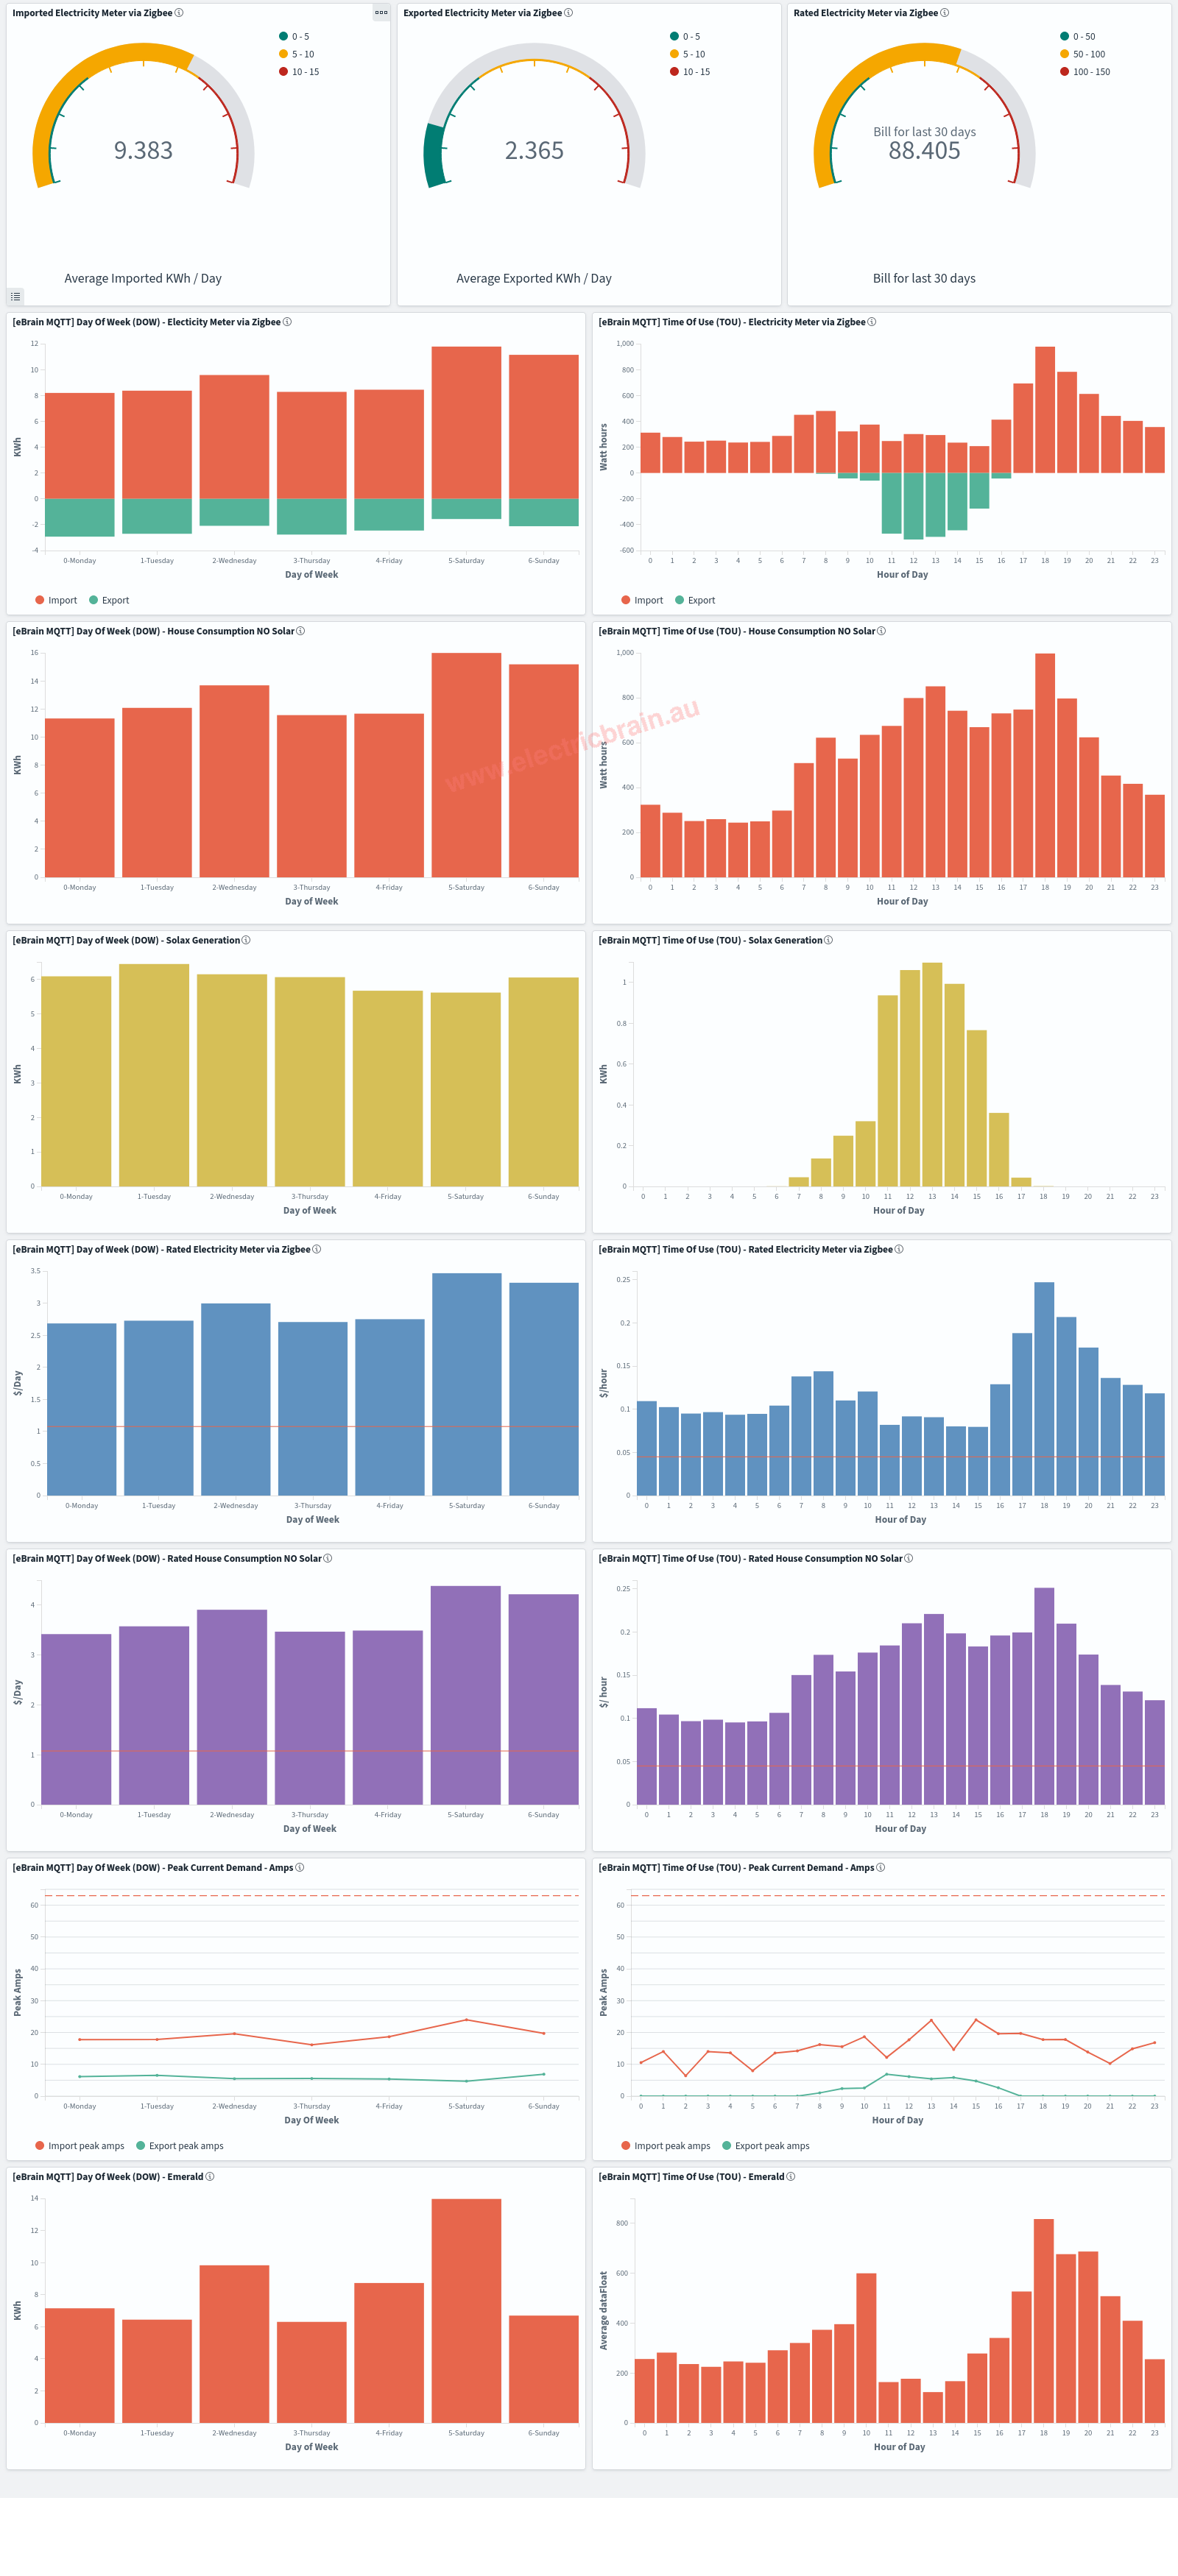
Data sources are the Distributor's electricity meter via the Zigbee Gateway Rainforest Eagle (1st Gen) iCredit as well as the Solax X1 inverter itself. The main difference between the two electricity meter measurements is the flashing LED reading Emerald EMS can't see exported electricity. That means the lower two graphs only show consumption whereas the top graph goes negative (meaning exported electricity is measured).
Generally the green parts of the graph come directly from the Solax inverter SigEnergy panels. We inherited a bottom of the line Solax X1 system in the new house (which has been fully compromised and is providing data, via a Raspberry Pi Zero W, directly to the MQTT server - no more Chinese cloud servers are involved). In fact a SigEnergy warranty condition now forces the use of the manufacturers cloud service (AWS in Sydney). That also has forces extraordinary security measures to prevent the Chinese Bureau of State Security from poking about in the Electricbrain Data Center. The entire inverter now looks like another IoT device as far as
OpenHAB and the analytics are concerned (a page on this is yet to come - suffice to say that the Solax inverters are now so common that everything has been hacked and is publically available on the web - all of which sounds bad, however this project wouldn't possible without said hacks. As it turns out this has actually become a reason to buy Solax). What is also revealed by the new analytics is that the Solax actually performs quite well given we have such a poor quality installation job.