Fronius inverters are capable of pushing various reports out to a collection server.
Here we operate an "Analytics Cluster" for listening to logs of all sorts. The analytics consists of ElasticSearch, Logstash and Kibana Open Source Software edition (ELK-OSS).
Fronius has a document which describes how to configure the data logger component to push data in to an FTP server. While security of FTP is always questionable in this case everything is behind the firewall, offering slightly better privacy.
Fronius PDF document describing the setup: LINK
It's also important to set the Fronius to "Night Mode" on. This ensures all data is transmitted, even at night.

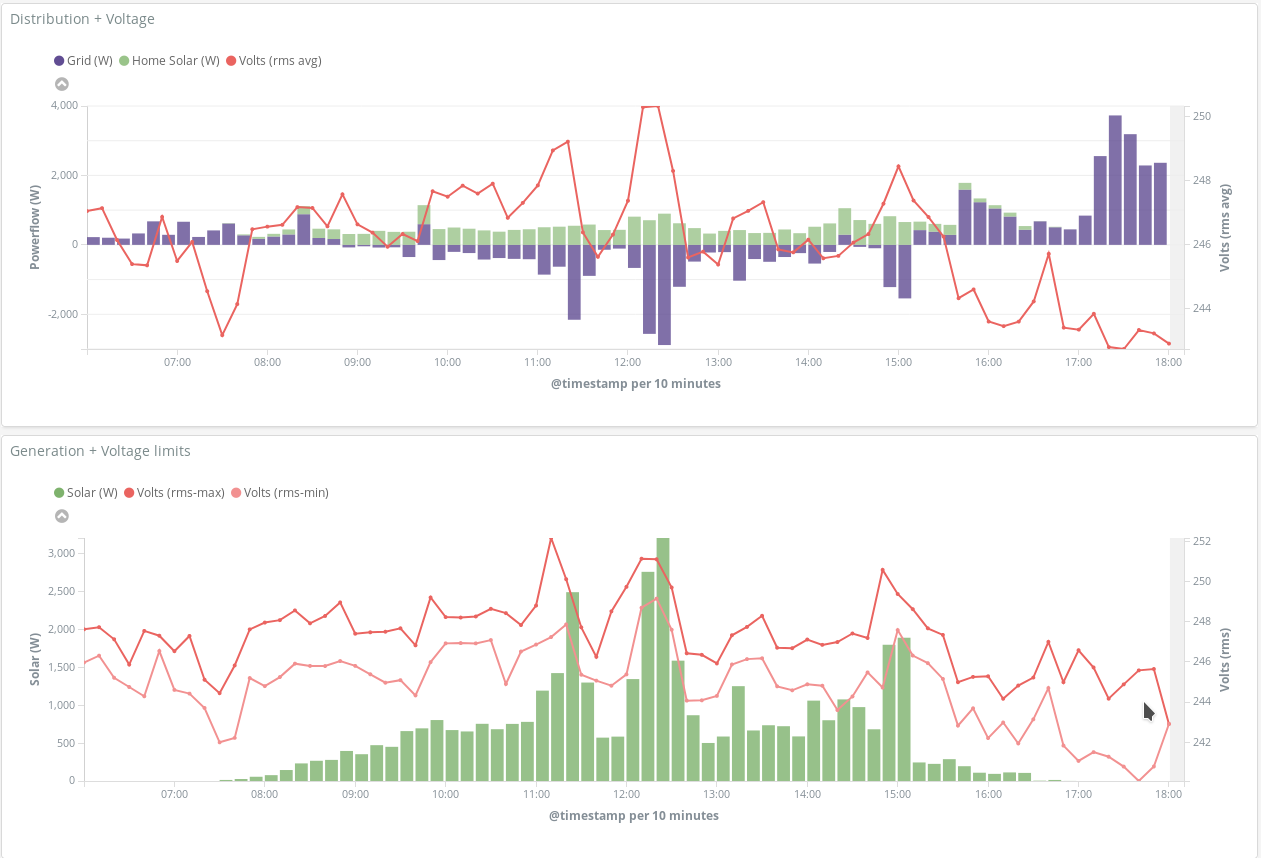
The top graph shows household consumption with purple being grid power flow. Green is solar self consumption. Voltage is the RMS average during the bar interval (note: the voltage information is not provided by the fronius inverter - it is coming from Power Analyzer) from the . It's pretty obvious we're in winter here in Melbourne at the tim eof writing :-)
The lower graph shows average generation over the bar interval. The red lines show max and min voltage during the interval.
Configuring the analytics is (well) beyond the scope of this article