Demand Tariffs - AEMO AEC CER
13 June 2024
What are demand tariffs? In this ABC News special report the consequences of this type of billing are described (mostly you're going to pay probably a lot more for the same old electricity). On this page we try to describe the issue and why you as a consumer have very little insight into what's really going on. At the heart of the matter is the technical difference between Power and Energy. Read on as we attempt to explain the terms within the context of your power bill.
It's safe to say this issue is shrouded in technical jargon which is more or less incomprehensible to many electricity consumers. Even knowledgeable engineers in the domain would have difficulty coming to grips with the systems govenments are attempting to put in place. An example of such a system is the Victorian aggregated data collection system here. One could argue that this gobbledygook intentionally hides the facts.
Ignoring the government's overarching requirement to provide their populations with electricity, for the sake of simplicity, we'll just say it costs money to provide the poles and wires to get the said electricity to your home from the now geographically dispersed sources.
Once upon a time it was pretty simple to work out how much that cost was. Everything (coal) came from a big open cut mine and was shovelled into a big boiler (like a steam train). The boiling water created high pressure steam which was squirted into a turbine. The other end of the turbine powered generators which connected to the poles and wires.

Now days, of course, those big polluters have largely shutdown and electricity comes from all over the place. Wind turbines, solar panels, batteries, the remaining coal fired power stations to name a few. The poles and wires now have to be upgraded and expanded to lots of different places to deliver the power from these diverse sources. What used to be poles out in the countryside are now huge transmission towers carrying enormous cables "high up in the air" (although PissOffAusnet would beg to differ about height thing). And that's expensive.
How big should the towers and transmission lines be? Well ultimately that depends on what gadgets you have in your home. Industry is a different kettle of fish, because they know how much power they need and when they need it which means it's pretty straight forward to workout sizes and costs. Home users, by and large, generally only have a vague idea of how much power they might need and when they want it, so governments are trying to measure it.

Prior to the advent of "smart meters" the old spinning wheel mechanical electricity meter couldn't measure power. They just measured total energy. In this article on the ABC website:
What are smart meters the basic cost savings are outlined (the meter reader man has lost his job), however, there's no mention that as well as your energy consumption being measured your power levels can now also be measured and recorded at a central location.
Now that individual household power levels can be measured your contribution to the size of infrastructure needed to deliver the energy used can be apportioned, which has historically been technically impossible to do.
What this means is best illustrated with the heating and cooling example. Turning the heater/cooler on in the morning and evening compared to keeping a less powerful system on all day. Changing the house temperature in a short space of time needs a lot of energy in a short space of time (high power). However running a smaller less powerful system all day might well use the same total energy. The key difference is in the amount of infrastructure needed to deliver that energy. The smaller less powerful system will run with smaller thinner wires - which cost less to provision. In the days of the old spinning wheel meter, it was impossible to distinguish which was which. Demand tariffs try to apply a user pays principle to the cost of those poles and wires
A more complete description of the technical details follows.
TLDR
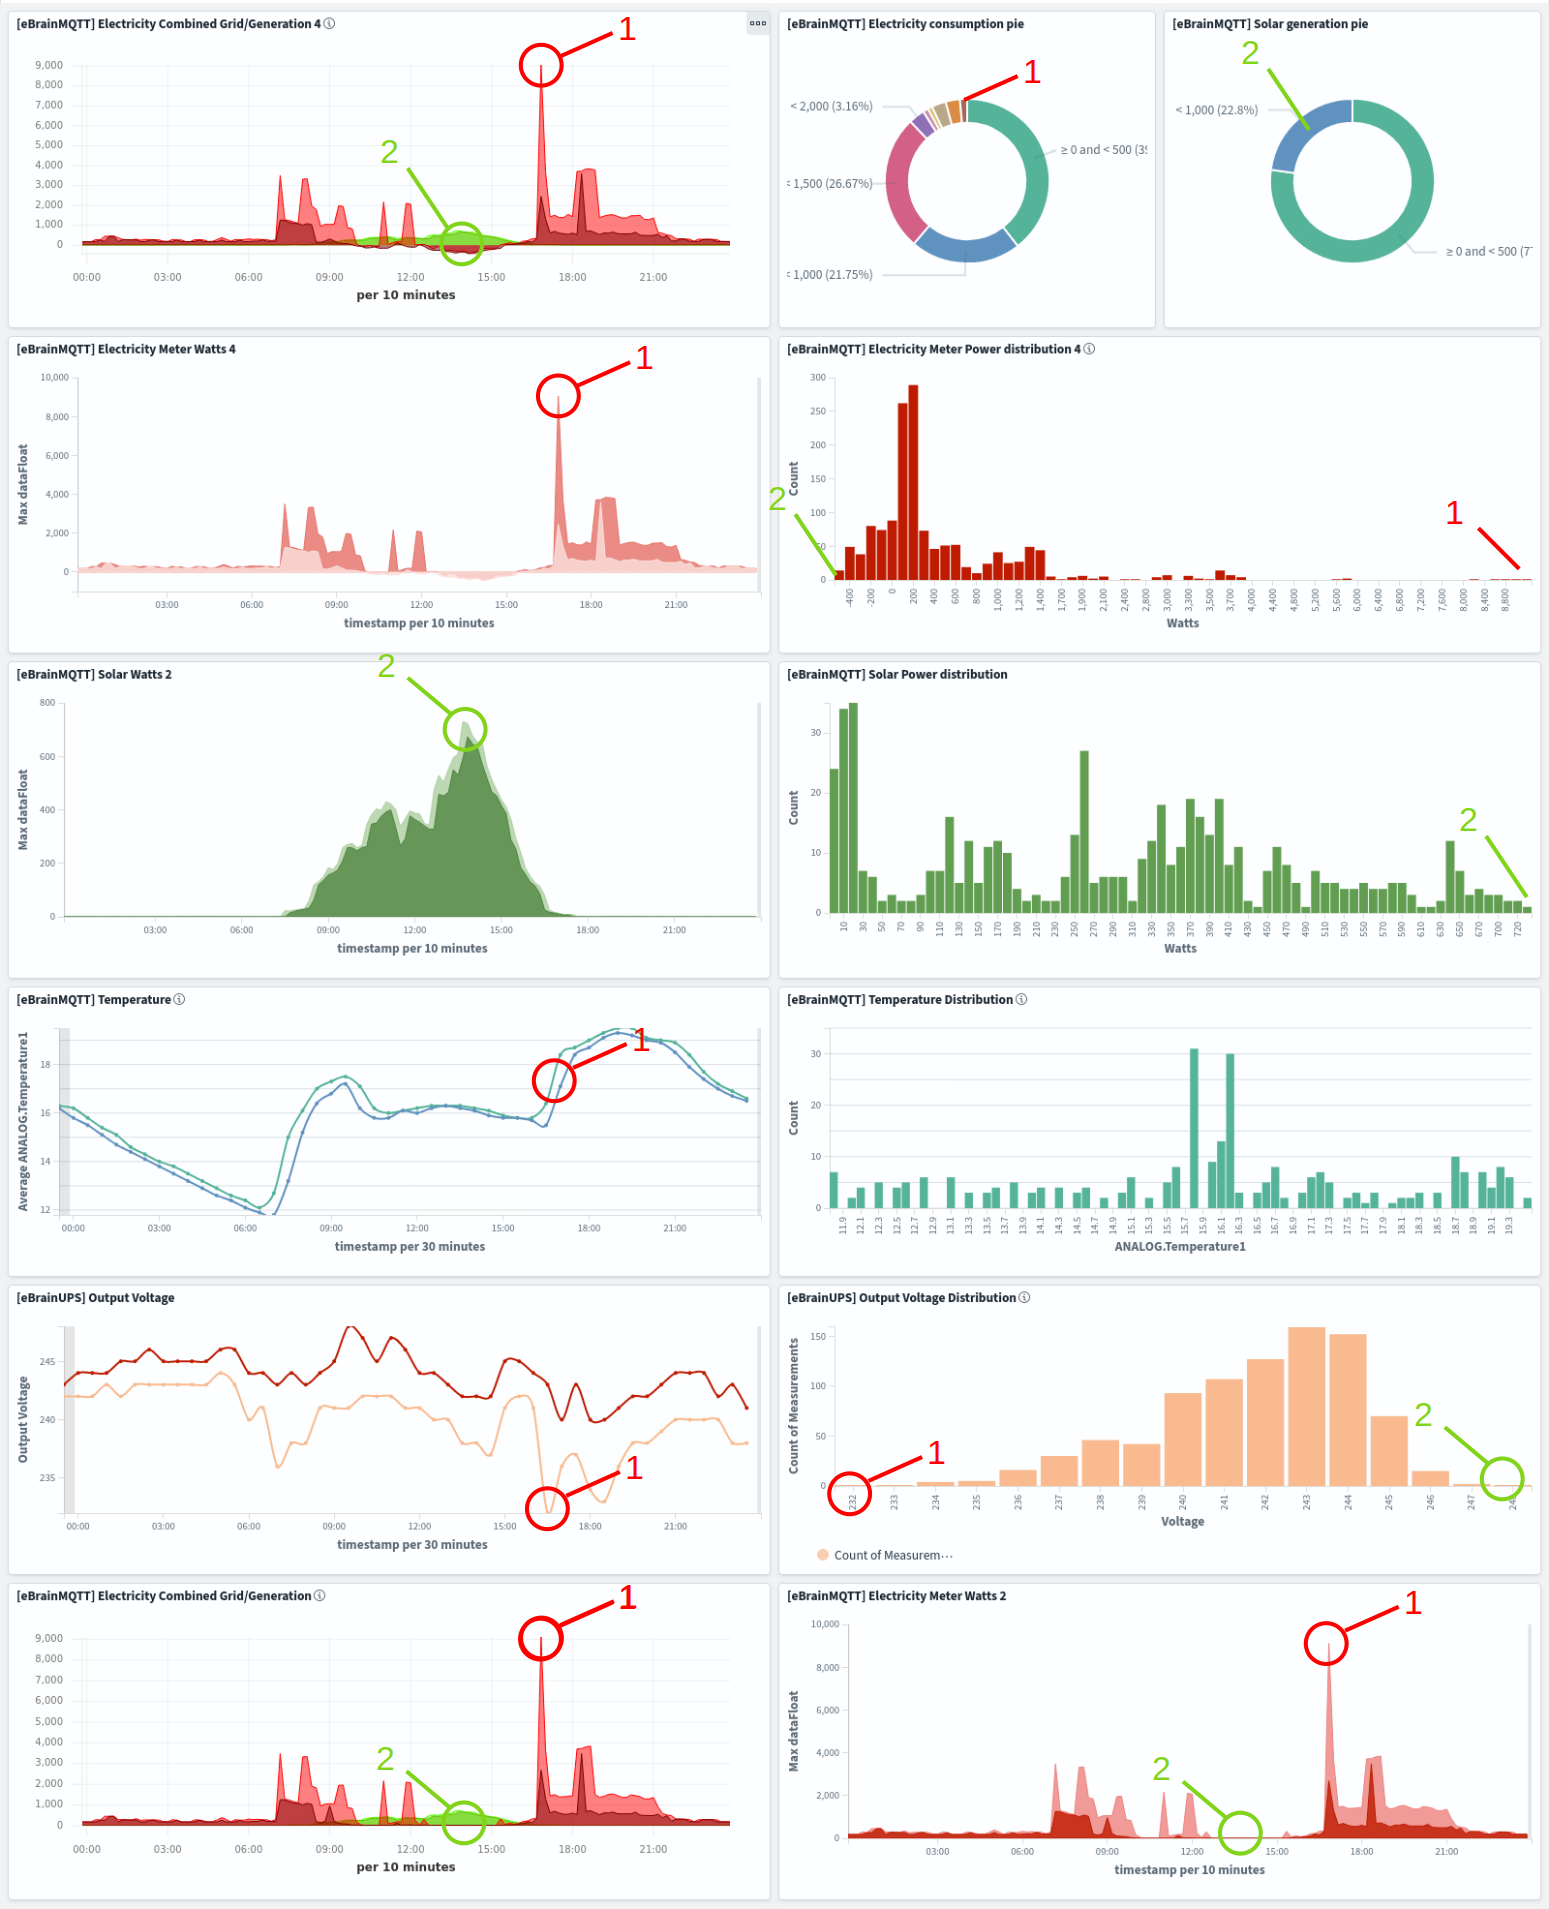
The collection of graphs above are an attempt to characterize what's going on. Essentially the scenarios are a "typical" day in the life of a "normal" household . It depicts a 24 hour period recorded by the various bits of hardware feeding their collected pieces of information into the "analytics pipeline" which gobbles it up and spits it out into Opensearch. Opensearch then analyzes all the data and produces the beautiful graphs.
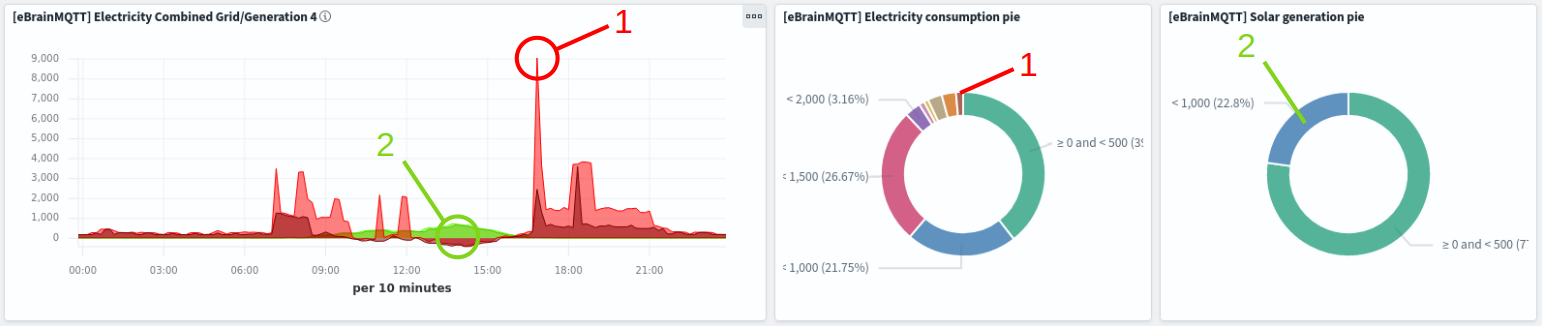
(Left) ConsumptionGeneration/TimeOfDay - (Center) PowerConsumptionLevels% - (Right) GeneratePower%
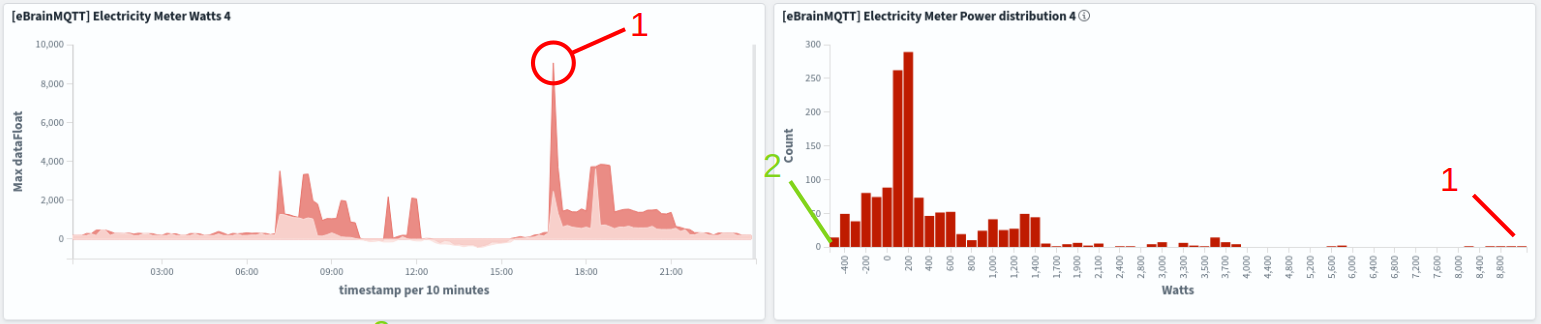
In our scenario (number 1 - red), there was an attempt to turn on all the power hungry appliances in the house at around 5:00pm in early June 2024. So the heater, the aircon cooling, the induction cooktop, the electric oven, the air fryer, the TV, all the computers, lights etc. etc. The result is the number 1 scenario. As can be seen from the top left graph all those appliances turned on at one came to a total consumption of some 9000 watts. And that's quite a lot. (Note: The EVs were not charging - that will be dealt with separately).
I can already see lots of people's eyes glazing over. What the hell is a watt? Well before even attempting any explanation at all, the first thing that has to be said about watts is - you have to pay for them! And as time goes on, here in Australia where we're transitioning away from coal, we all have to pay more, essentially for new poles and wires and alternative power generation systems. Obviously there is a political dimension to this, because pretty much everyone is effected, which will not be entered into here as far as is possible.
Now before all the electricians point out that you don't get billed for kilowatts you get billed for kilowatt hours, which is to say you don't pay for power you pay for energy, and that is in fact the central issue here.
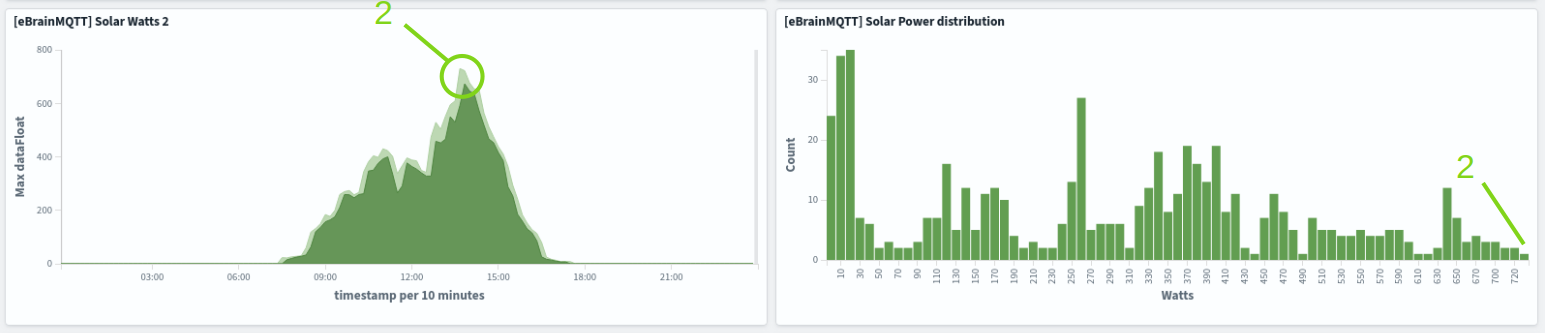
(Left) GeneratedPower/TimeOfDay - (Right) CountOfMeasurements/PowerWatts
Scenario 2 (green) depicts the middle of the day (in winter - so not much sun) when the sun is shining on eveyone's the solar panels. All the appliances are off, the dogs are warm sitting in the sun and electricity is flowing into the grid out from the house. The minimum power consumption has gone negative - that is to say the power company is now paying us (a pitance) for our generated solar electricity. More on this later.
These two scenarios are meant to illustrate the two extremes in the power landscape from a householder's (some might say voter's) perspective. Most people will fit between number 1 and number 2 somewhere. There's currently no battery system installed here, which would have a significant impact on how things work.
For the more technically minded reader these graphs were produced locally here with the aid of some very sophisticated hardware and software most of which is detailed on various pages throughout the site.
- The computer cluster
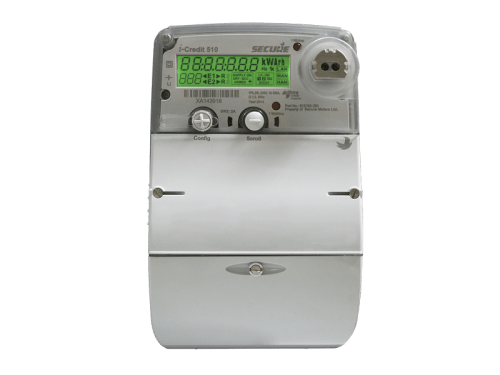
- Electricity meter - Emerald EMS - FREE!!
- Electricity meter - Rainforest Automation
- Grid Voltage - Jaycar UPS
- Tasmota home automation - temperature
- Opensearch cluster Analytics
Power or Energy
The poles and wires connected to your house are a certain size. They become too small when the power a house consumes causes the voltage to become too low. Essentially that happens when there isn't enough power at the house end of the wire. In Australia that voltage should be 230 volts or there abouts (+10% and down to -6%, set by Australian Standard AS/NZS 3112).
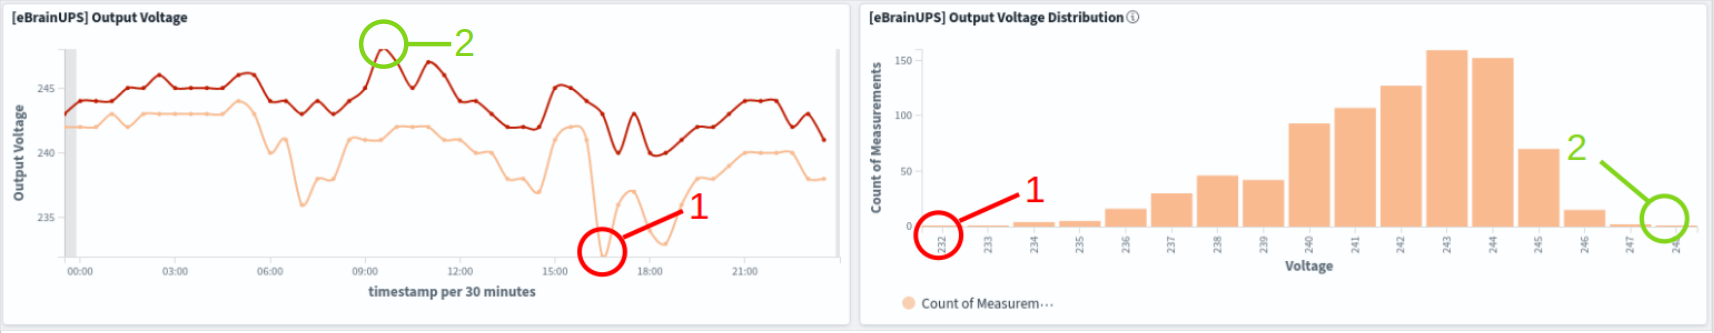
(Left) Max+MinVoltage/TimeOfDay - (Right) CountOfMeasurements/Voltage
As can be seen in graphs here the voltage minimum dipped to 232 volts (Left graph Red #1) for a short time when everything was switched on. The wires here are pretty good. Should the voltage in your house go below the minimum allowed voltage of 216 volts then household appliances might not work anymore. That means there isn't enough power available. Grid failure.
Conversely as shown in scenario 2 in green, when the sun is near its highest at around midday with no clouds, when all the neighbours' solar systems are busy generating electricity along with our house's system, the voltage might start creeping up. Should it exceed the maximum permissible 253 volts then appliances might burn out.
With the rise in popularity of appliances such as multi-headed air conditioning system such as these being installed to replace old gas heating systems, a power consumption of 10kW plus are not as uncommon as they once were. It's entirely plausible that household voltages could dip below the minumum. In that case the wires to the house would need to be upgraded to thicker higher capacity types. A typical solution is to add more phases up to the maximum of 3 phase power trippling available power. Basically the long and short of the story to this point is that the wires to older houses are too thin. Modern houses have thicker wires and/or multiple phases (which is currently being banned in some localities - i.e. you may not be allowed to connect 3 phase power anymore).
A whole new suburb may now need significantly thicker wires and bigger poles. Only properly aggregated data can answer this question. And electric cars only compound the issue.
So the issue at hand is that while total energy consumed per month may end up being the same amoung equivalent households, that energy can now be consumed at a very high rate. The analogy is the petrol tank of a car. 50 litres of petrol costs the same no matter which car it goes in - it's the same amount of energy. But as we all know, that big Dodge RAM is going to guzzle it in pretty quick time - big power.
(Left) Max+MinPowerConsumption/TimeOfDay - (Right) CountOfMeasuments/Watts
Some jurisdictions are now turning to the dreaded "demand tariff" to control the amount of capital expenditure needed to support higher power demand and so avoid a grid failure (the voltage goes too low). What they're doing is looking at the consumption graphs (the second row of graphs) and looking for the highest point. Then they argue that since you need that amount of energy in a short space of time (high power) they have to provide thicker wires to you - pretty much all the way back to the generator source. The thicker the wires the more money it takes to provision. Guess what - you have to pay more, even though your total energy usage might not have changed - for example you may only turn the AC on in the morning or the evening.
Avoiding a demand tariff might mean using a smaller air conditioner but having it on all day. It ends up using the same energy but is less powerful so the wires to your house can be thinner, so a correspondingly smaller demand tariff. All the big power hungry household appliances in the home should be the lowest powered that will do the job.
Of course there is another way to provide some customers with more power albeit at the expense of other customers. Blackouts or Loadshedding (which sounds waaay better - but the lights still go out) If your suburb or town is at the receiving end of an electrical transmission line and the voltage goes too low because the power demand is too high in your area, then simply switching off the neighbours can resolve the issue for the remaining customers. Rolling blackouts are an attempt to "share the love" as the old hippies used to say. Depending on who you listen to, we may be near that point in some Australian geographies.
At the other end of the energy spectrum is solar system energy production. Another issue which has come up is that there is now an abundance of power/energy in the middle of the day when, apparently, nobody wants it. The symptoms observed at the customer end of the wires is that the grid's voltage floats up to very high levels. The grid operator's ability to cope with such an abundance is now reaching a limit. Currently solar system feed-in tariffs are all but zero during the middle of the day. There's now even talk of grid operators charging solar system owners to take feed-in power off their hands.
A solution to many of these issues is to add a battery to the household energy mix. The idea is essentially to charge the battery when there's an abundance of cheap power and then use that at high demand (expensive) times.
The bottom row of graphs shows power measurements from the Victorian Government's attempt at providing useful consumption information to householders. The Emerald EMS system, which attaches to your electricity meter and reads the flashing LED is meant to provide consumption information via a mobile phone app. Unfortunately the device can't read solar exports limiting its usefulness. It's included in the graphs above because it's basically too much work to remove it again.
more here.
Media organisations may contact @electricbrain2 via twitter/X regarding republishing rights. This author was formerly a technical contributor for The Age, Sydney Morning Herald, and the Australian Financial Review (back in the day).